COVID-19 Data Driven Generative Art
Tully Jones-Wilkins, High School Student, The Delta School.
Data: “facts and statistics collected together for reference or analysis.”
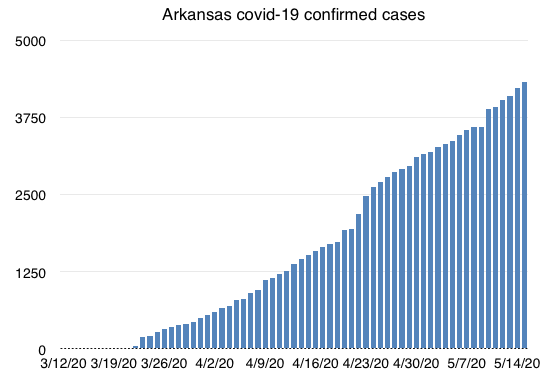
In this project I had a small, one dimensional data set. The confirmed Covid-19 case numbers for my home state of Arkansas.
I combined the data set with an creative programing languange called Processing. Processing, a depreciating javascript platform was the perfect introduction to programming and creative coding for a beginner like me. Through the large community of artists on the platform it created the prefect environment for asking for help. Learning from others, and iterations from community designs.
It began with data and statistical analysis. Consolidating data into simple .csv files and starting to introduce them into the processing sketch.
Table table;

void setup() {
   table = loadTable("arkansas_confirmed.csv","header");
}
void draw() {
  for (int col = 0; col < table.getColumnCount(); col+=1) {}
      TableRow state = table.getRow(0);
      if (col == table.getColumnCount()){
        col = 0;
      }
      else {
        col++;
      }
    data = table.getInt(0,col);
  }
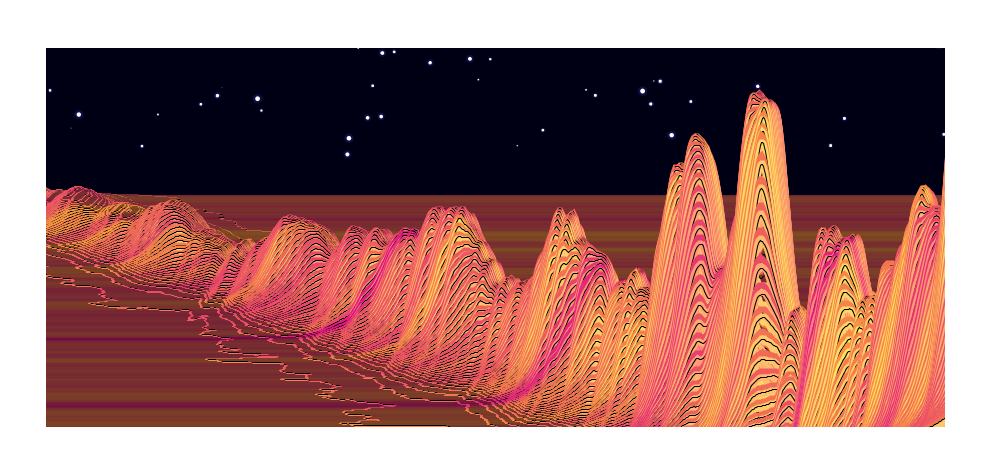
After inputting data I was looking for a way to visualize the data. But I was not excited to create a graph or a conventional data visualization. I developed a function that uses mathematical processes to draw a line based on the data set. The function creates a mountain-like design that is critical to visualize the progression of the virus- both the rises and the falls.
  float n = noise( x/wow + frameCount/50.0 + y0);
  vertex( x, y0 - boo / (1 + pow(x-binc, 4) / 6e6) * n);
Input that noise and vertex function and equation into a for loop, set variables and line color and you find yourself with the following generation.
Next I wanted to create a collective feeling through the peice. Representing the collective spirit in communities response to the pandemic.
  int k=0;
    if(k == 50){ // setting limit for incrementation
     k=0;
  }
  for (int y0 = 250; y0 < 600; y0+=7){
     k++; // incrementing colors
     stroke(colors[k]); // loops color through lines
     lines(y0); // draw lines at different y-axis every loop
     noStroke();
    }
Series 2
After aligning the forces of data and generation, through loops, parameters and a very large color array. I wanted to iterate further, I wanted to create a landscape. I implemented a new way of drawing the lines on the page. Instead of one simple function looping, use a function with three parameters all controllable and customizeable.
The javascript void drawLine(var y0,color to, color from){ function made this possible.
entire function:
void drawLine(int y0, color to, color from){
if (y0 >= 550){
  go = true;
}
if (!go){
  inc();
  float data = table.getInt(0,col); // localizing data variable
  println(data);
  float elev = map(data, 0, 4324,50,600); // mapping elevation value to num of cases constraints for elevation.
  fill(255,4);
  beginShape();
  curveVertex(-50,y0);
  for (int i =0 ; i<width/stair+3;i+=1){
     float noiseVal = noise(i*noiseScale*(y0*0.06), frameCount*noiseScale);
     stroke(lerpColor(from,to,noiseVal));// lerpcolor finds the color in a range of two. ex. if its green to yellow the lerpcolor would output blue
       noFill();
  for ( int y = 360; y < 650; y += 10 ) {
    for ( float x = 0; x < width; x++ ) {
        float n = noise( x/60 + frameCount/50.0 + y);
        vertex( x, y0 - elev / (1.0 + pow(x-binc, 4)/ 10e6) * n + noiseVal);
    }
    //println(y0);
    vertex(width+10, height+200);
    vertex(0, height+220);
    vertex(0, height+230);

    endShape(CLOSE);
      }
    }
  }
}
The next thing I wanted to implement is a vertical loop that allowed for the y axis depreciating increment.
int ofs =0;
int ofs_v =1;
int offset = 300;
//-------------------------------------
  ofs+=ofs_v;
 if((ofs==offset) || (ofs==0))
  {
   ofs_v=0-ofs_v;

  }
I then needed to implement the ofs variable into the drawLine function to allow for simultaneous incrementation.
strokeWeight(6);
  drawLine(200+ofs,#3E0338,#1907ED);// calling drawLine function. //assigning colors
  drawLine(202+ofs,#9594AA,#2A0650); // drawing and creating mountains. //assinging different colors
  strokeWeight(1); // defining the mountain with black stroke creating shadow and texture effects
  drawLine(198+ofs,0,0);
Write a star class for aesthetics!
//stars display class, way to iterate the same shape over and over, controlled by perameters
class Star {
  float x, y, dia;

  Star(float x, float y, float dia) {
    this.x =x;
    this.y =y;
    this.dia = dia;
  }
  void display() {
    //code for displaying the circles
    //background(0,0,20);
    noStroke();
    //fill(60, 60, 190, 60);
    fill(60, 60, 230, 60);
    ellipse(x, y, dia, dia);
    fill(255);
    ellipse(x,y,dia/2,dia/2);
  }
}
And outcomes a landscape generation